Production observability on two small VPSs: metrics, logs, traces and SLOs with Grafana LGTM

When I started, the platform had no monitoring at all. No host metrics, no central logs, no alerting, no traces. If a page was slow, the only tool was docker logs and a guess.
The platform is an ed-tech product: a handful of FastAPI services on MongoDB Atlas, a Django service on PostgreSQL, React frontends and MinIO for uploads, all in Docker Compose on two VPSs: production and dev. No Kubernetes, no budget for a SaaS observability bill, and a small team.
This post walks through what I built, with the real configuration, and the numbers it produced in the first week. It is long; each section stands on its own.
What you get at the end:
- metrics, logs and traces for every service, linked to each other: one click from a log line to its trace and back;
- per-endpoint and per-query latency computed from 100% of requests, while storing only a sample of traces;
- the ability to tell "the network to the database is slow" apart from "this query is slow";
- SLOs with multi-window burn-rate alerts;
- two servers that watch each other, plus a dead-man switch for when both are gone;
- all of it in about 650 MB of RAM per server, deployed by Ansible.
1. Why self-hosted LGTM
I compared four options before writing anything:
| Option | Why not (for this project) |
|---|---|
| Datadog / New Relic | Excellent, but per-host + per-GB pricing grows faster than the company. |
| Grafana Cloud free tier | Close, but the free limits (traces, log volume, retention) were too tight for 100% span metrics. |
| ELK / OpenSearch | Heavy on memory (JVM) for a 6–8 GB VPS that also runs the apps. |
| Prometheus + Loki + Tempo + Grafana, via Grafana Alloy | Small, open source, one query UI for all three signals, native OpenTelemetry. Chosen. |
The deciding factor was RAM. The whole stack, with hard limits on every container, fits next to the applications:
| Component | Version | Memory limit |
|---|---|---|
| Prometheus | v3.15.0 | 512 MB |
| Loki | 3.7.8 | 1 GB |
| Tempo | 3.1.0 (single binary, local storage) | 384 MB |
| Grafana | 13.2.4 | 768 MB |
| Grafana Alloy (two agents) | v1.20.1 | 256 + 320 MB |
| Alertmanager | v0.34.1 | 64 MB |
| Blackbox exporter | v0.29.0 | 32 MB |
| cAdvisor | v0.60.6 | 160 MB |
Real usage settles around 650 MB on the production box. The limits are there for the bad day, not the average one.
Retention: metrics 30 days (with a 12 GB size cap), logs 30 days, traces 7 days on production; about half that on dev.
2. Architecture of one server
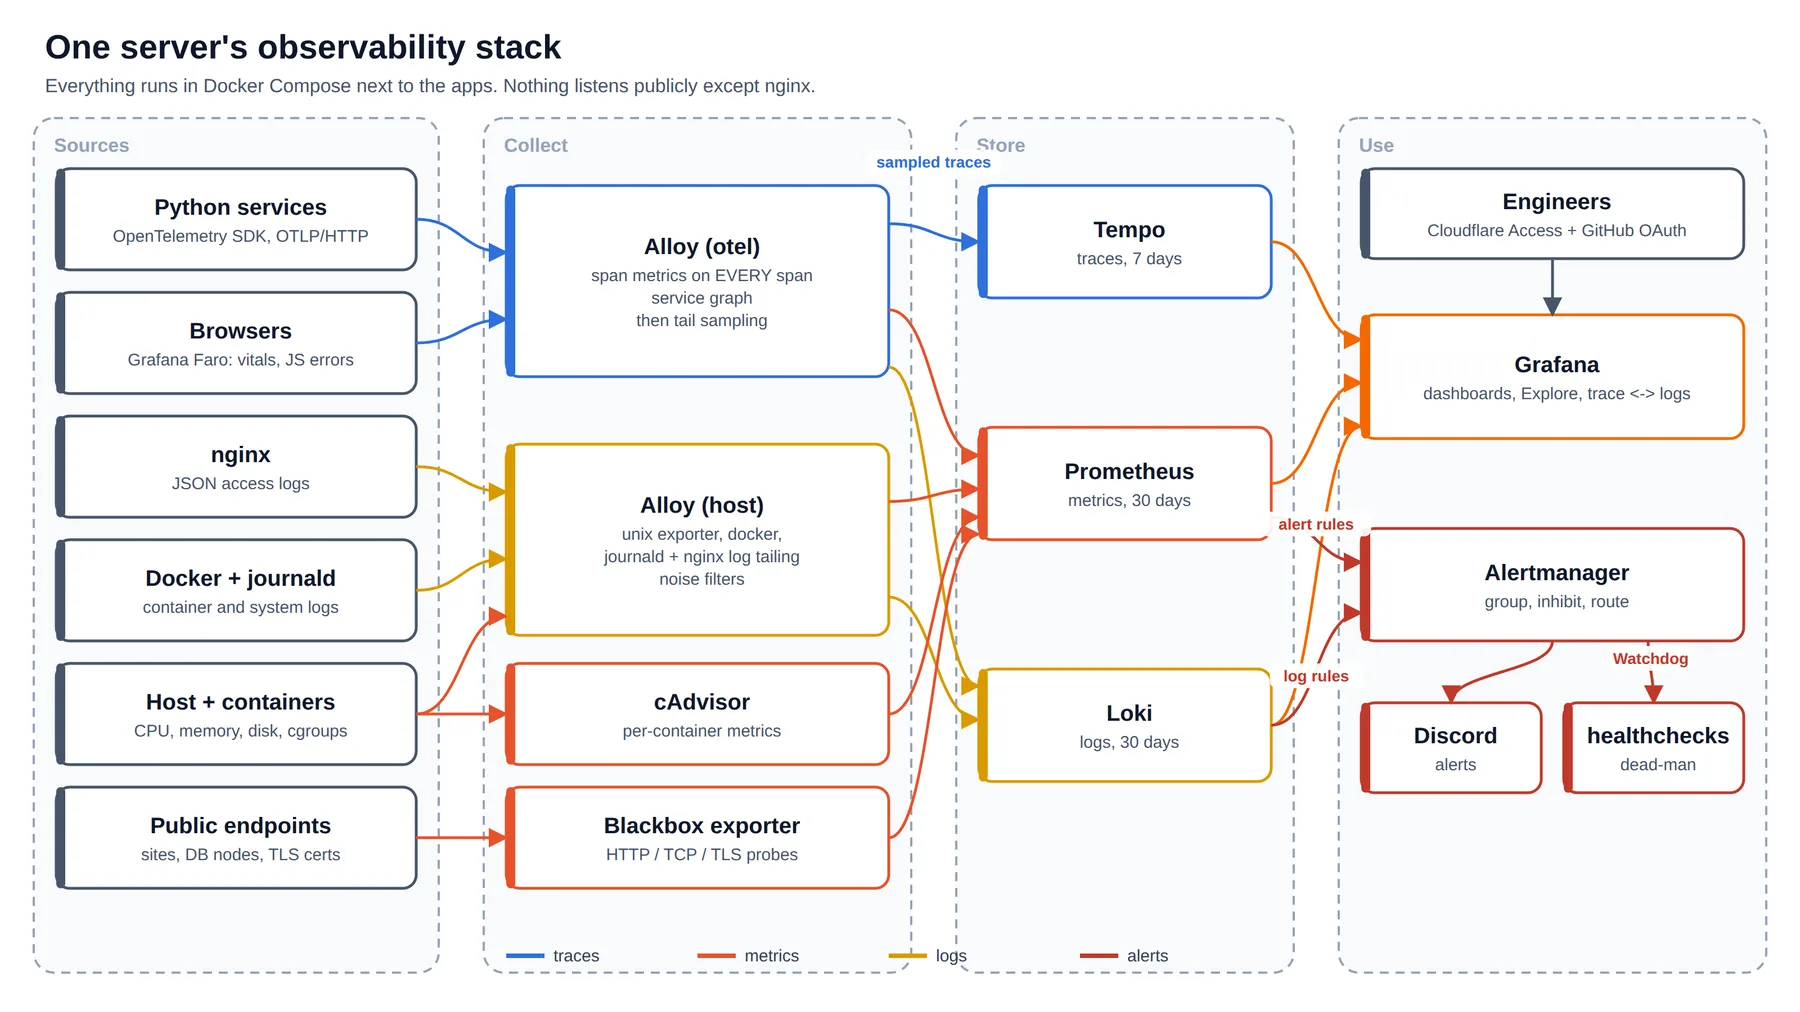
The design has a few rules:
- Every port binds to
127.0.0.1. The only listeners reachable from outside are nginx on 443 (Cloudflare IP ranges only) and an mTLS gateway for the other server (section 3). - Two Alloy agents, not one.
alloy-hostneeds host PID/network namespaces and read access to journald and the Docker socket. The OpenTelemetry agent needs none of that. Splitting them means the agent that accepts network traffic from apps has no host privileges. - Everything is code. Alert rules are files, linted with
promtoolandamtoolbefore every reload; dashboards are JSON generated by a script and provisioned read-only. The whole thing is one Ansible role, identical on both servers, parameterised bygroup_vars. - Every container has a memory limit and a CPU cap. Section 9 explains why that alone is not enough for Go programs.
Apps send OTLP over HTTP to http://alloy:4318 on a shared Docker network called otel. If the agent is down, the SDK drops spans and the app keeps serving; telemetry must never take the product down.
3. Two servers that watch each other
A monitoring stack on the same box as the apps has an obvious flaw: if the box dies, so does the thing that should tell you. I did not want a third server just for monitoring, so the two servers watch each other.
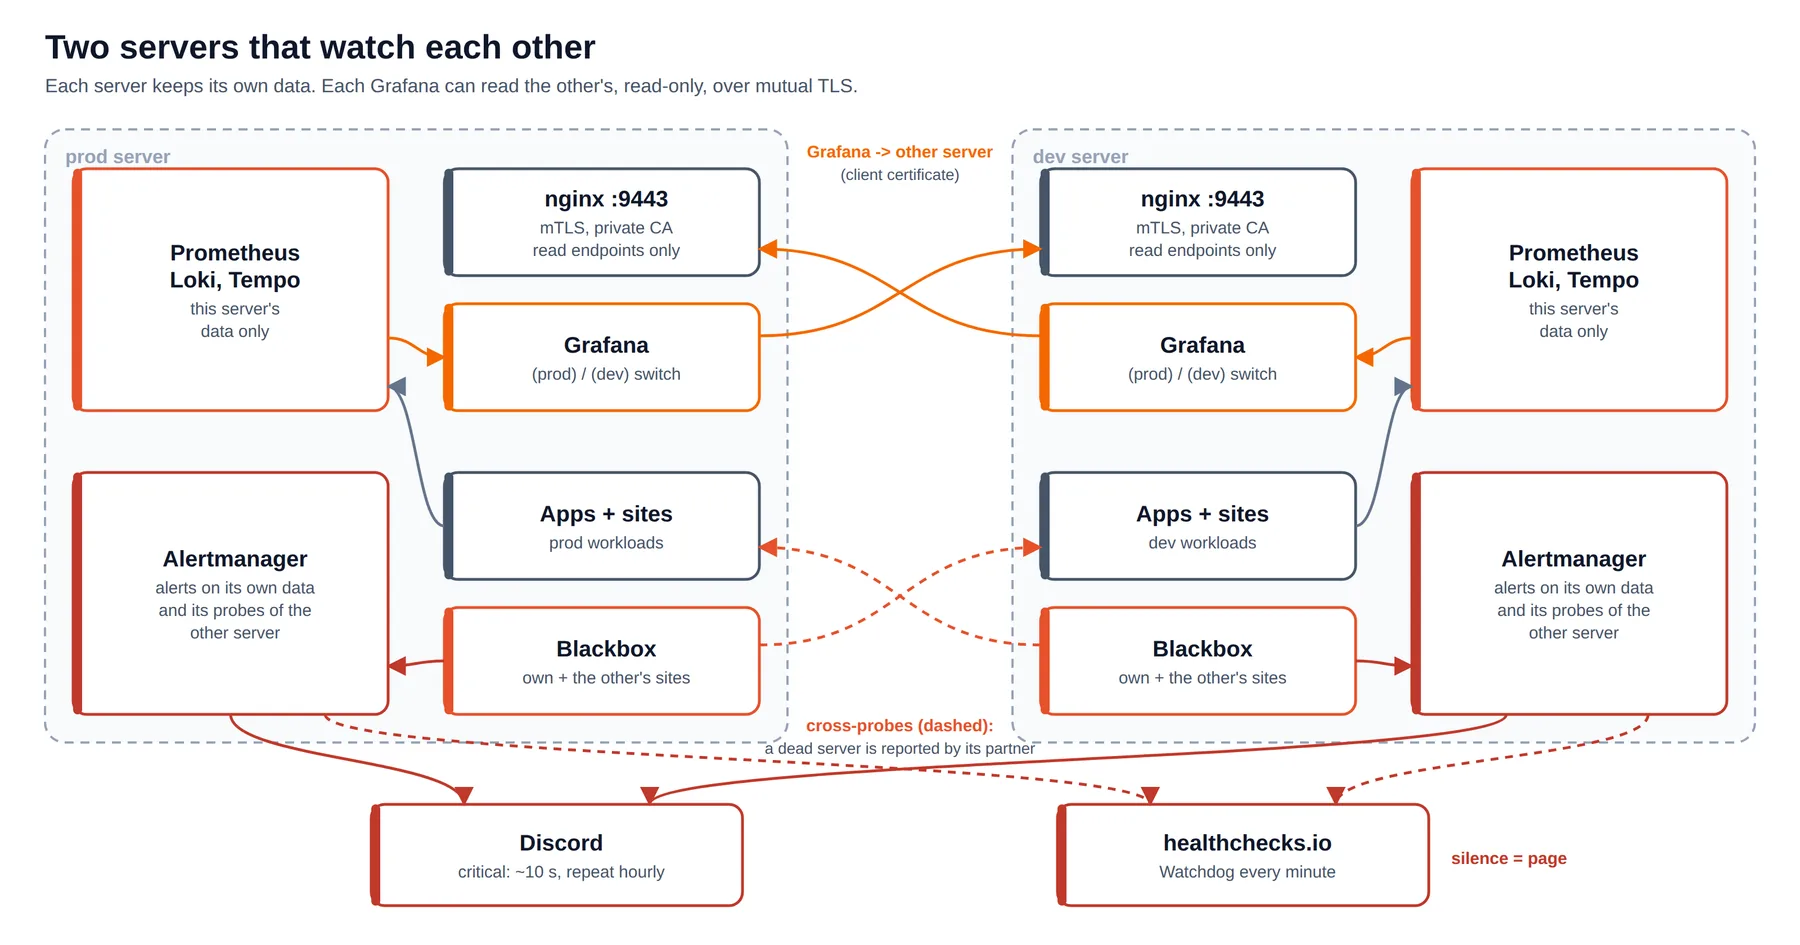
- Data stays local. Each server stores only its own metrics, logs and traces.
- Shared view. Each Grafana has a second set of datasources pointing at the other server. Every dashboard has a
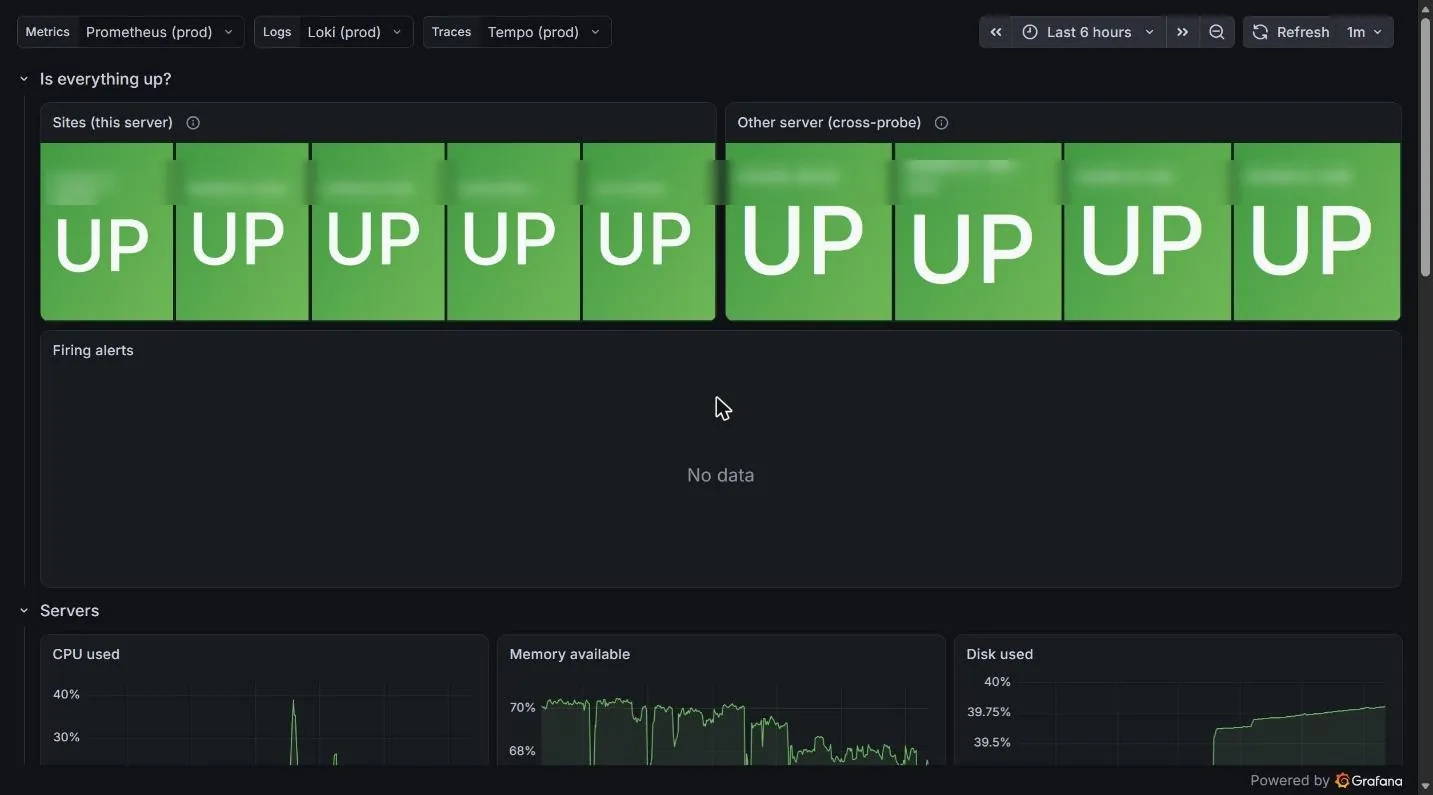
(prod)/(dev)switch. - Cross-probes. Each blackbox exporter also probes the other server's public sites and its gateway port. If prod disappears entirely, dev raises
RemoteServerDown. - Dead-man switch. A
Watchdogalert always fires and is sent to healthchecks.io every minute. If Prometheus, Alertmanager or the whole server dies, the pings stop and healthchecks.io alerts on its own. An alerting system cannot report its own death; an external check that expects a heartbeat can.
The cross-server link is plain nginx with mutual TLS and a read-only allow-list. A private CA (kept in a git-ignored folder on the Ansible controller) issues one client certificate per server; the firewall only opens the port to the other server's IP.
server {
    listen <gateway-port> ssl;
    ssl_certificate         /etc/nginx/monitoring-gateway/server.crt;
    ssl_certificate_key     /etc/nginx/monitoring-gateway/server.key;
    ssl_client_certificate  /etc/nginx/monitoring-gateway/ca.crt;
    ssl_verify_client       on;
    ssl_verify_depth        1;
    ssl_protocols           TLSv1.3;

    # Only the other server's client certificate.
    if ($ssl_client_s_dn !~ "CN=monitoring-dev-client") { return 403; }

    # Read endpoints only. Push, delete, admin and reload are 403.
    location ~ ^/prometheus/(api/v1/(query|query_range|query_exemplars|series|labels|label/[^/]+/values|metadata|rules|alerts))$ {
        limit_except GET POST { deny all; }
        proxy_pass http://127.0.0.1:9090/$1$is_args$args;
    }
    location ~ ^/loki/(loki/api/v1/(query|query_range|labels|label/[^/]+/values|series|index/stats|index/volume|detected_fields|patterns))$ {
        limit_except GET POST { deny all; }
        proxy_pass http://127.0.0.1:3100/$1$is_args$args;
    }
    location ~ ^/tempo/(api/(traces/[0-9a-fA-F]+|v2/traces/[0-9a-fA-F]+|search|search/tags|v2/search/tags|metrics/query_range))$ {
        limit_except GET { deny all; }
        proxy_pass http://127.0.0.1:3200/$1$is_args$args;
    }
    location / { return 403; }
}
I tested it the boring way: no client certificate fails the handshake; the right certificate gets 200 on /api/v1/query?query=up and 403 on POST /api/v1/write.
Why not federation, a VPN, or Cloudflare Tunnel? Federation copies data (double storage, and the copy is stale); there was no VPN and the team's IPs change; a tunnel adds a third party into a path that only two servers use. mTLS on one port is small and fully under my control.
4. Instrumenting the applications
Each FastAPI service has a small telemetry.py, imported first in main.py. Order matters: PyMongo only reports to listeners registered before a MongoClient is created, and the database module creates one at import time.
"""OpenTelemetry for this service: traces, metrics and logs over OTLP/HTTP.

Off unless OTEL_EXPORTER_OTLP_ENDPOINT is set, so tests and local runs behave
as before. Everything else is a standard OTEL_* variable the SDK reads itself.
"""
ENABLED = bool(os.getenv("OTEL_EXPORTER_OTLP_ENDPOINT"))

def _setup() -> None:
    resource = Resource.create({
        "service.name": os.getenv("OTEL_SERVICE_NAME", SERVICE_NAME),
        # Each uvicorn worker exports its own metrics; without a distinct
        # instance id their series would overwrite one another.
        "service.instance.id": f"{socket.gethostname()}-{os.getpid()}",
    })
    tracer_provider = TracerProvider(resource=resource)
    tracer_provider.add_span_processor(BatchSpanProcessor(OTLPSpanExporter()))
    trace.set_tracer_provider(tracer_provider)
    # ... MeterProvider and LoggerProvider the same way ...

    # Adds the value-free query shape and calling function to every query span.
    import query_shape
    PymongoInstrumentor().instrument(request_hook=query_shape.request_hook)
    RequestsInstrumentor().instrument()

if ENABLED:
    _setup()
The compose file supplies the rest through standard variables:
environment:
  OTEL_EXPORTER_OTLP_ENDPOINT: http://alloy:4318
  OTEL_EXPORTER_OTLP_PROTOCOL: http/protobuf
  OTEL_RESOURCE_ATTRIBUTES: deployment.environment=prod,service.namespace=platform
  OTEL_TRACES_SAMPLER: parentbased_always_on   # sampling happens in the agent
  OTEL_PYTHON_FASTAPI_EXCLUDED_URLS: health
Which query is slow? Query shapes
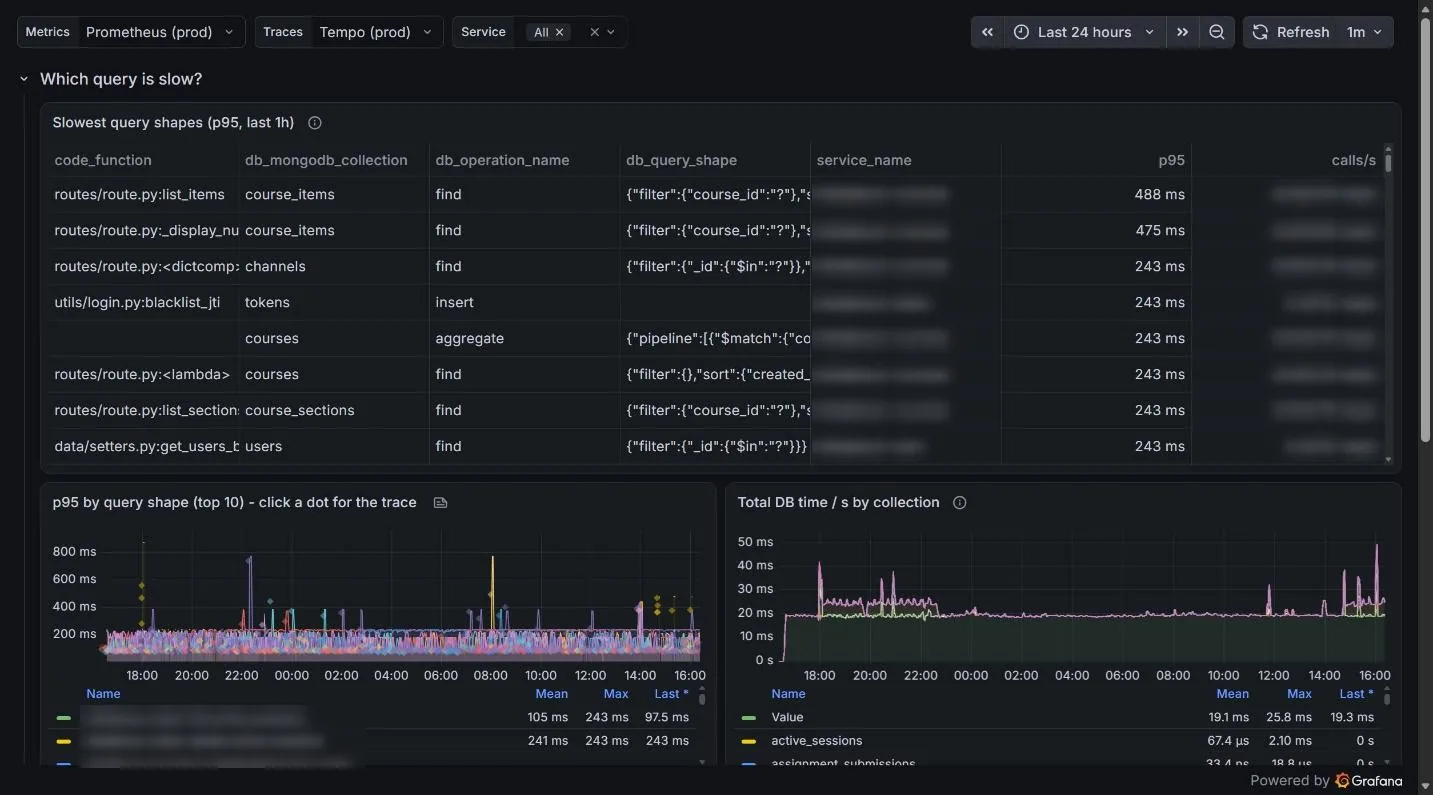
A span that says find app_db.course_items 488 ms is a start. What you actually want to know is which find, and who called it. The PyMongo request_hook adds three attributes to every query span:
db.query.shape: the filter, sort, projection or pipeline with every value replaced by?;code.function/code.lineno: the first frame in the service's own code that issued the query;db.operation.nameanddb.mongodb.collection.
def _shape(value, depth=0):
    """Keep keys and operators, replace every value with "?"."""
    if depth > 8:
        return "?"
    if isinstance(value, dict):
        return {key: _shape(item, depth + 1) for key, item in value.items()}
    if isinstance(value, (list, tuple)):
        if value and isinstance(value[0], (dict, list, tuple)):
            return [_shape(value[0], depth + 1)]
        return "?"
    return "?"
A real query becomes {"filter":{"price":{"$gt":"?"},"title":"?"}}: enough to recognise the query and the index it needs, and never any user data. That matters for privacy, and it also keeps metric cardinality bounded, because the shape becomes a metric label in the next step.
For the Django service, opentelemetry-instrumentation-django did not work at all: it is served by django-bolt, a Rust runtime that never passes API requests through Django's middleware stack. A small bolt middleware creates the server span instead, with the route rebuilt from path parameters (/api/products/{slug}/) so metrics stay per endpoint rather than per product.
5. Measure everything, keep a sample
This is the part I am happiest with.
Tracing every request and storing every trace is complete but expensive. Head sampling in the app (keep 20%) is cheap, but it throws away 80% of the slow requests you were looking for, and any latency metric computed from what is left is biased.
The fix is to compute metrics before sampling:
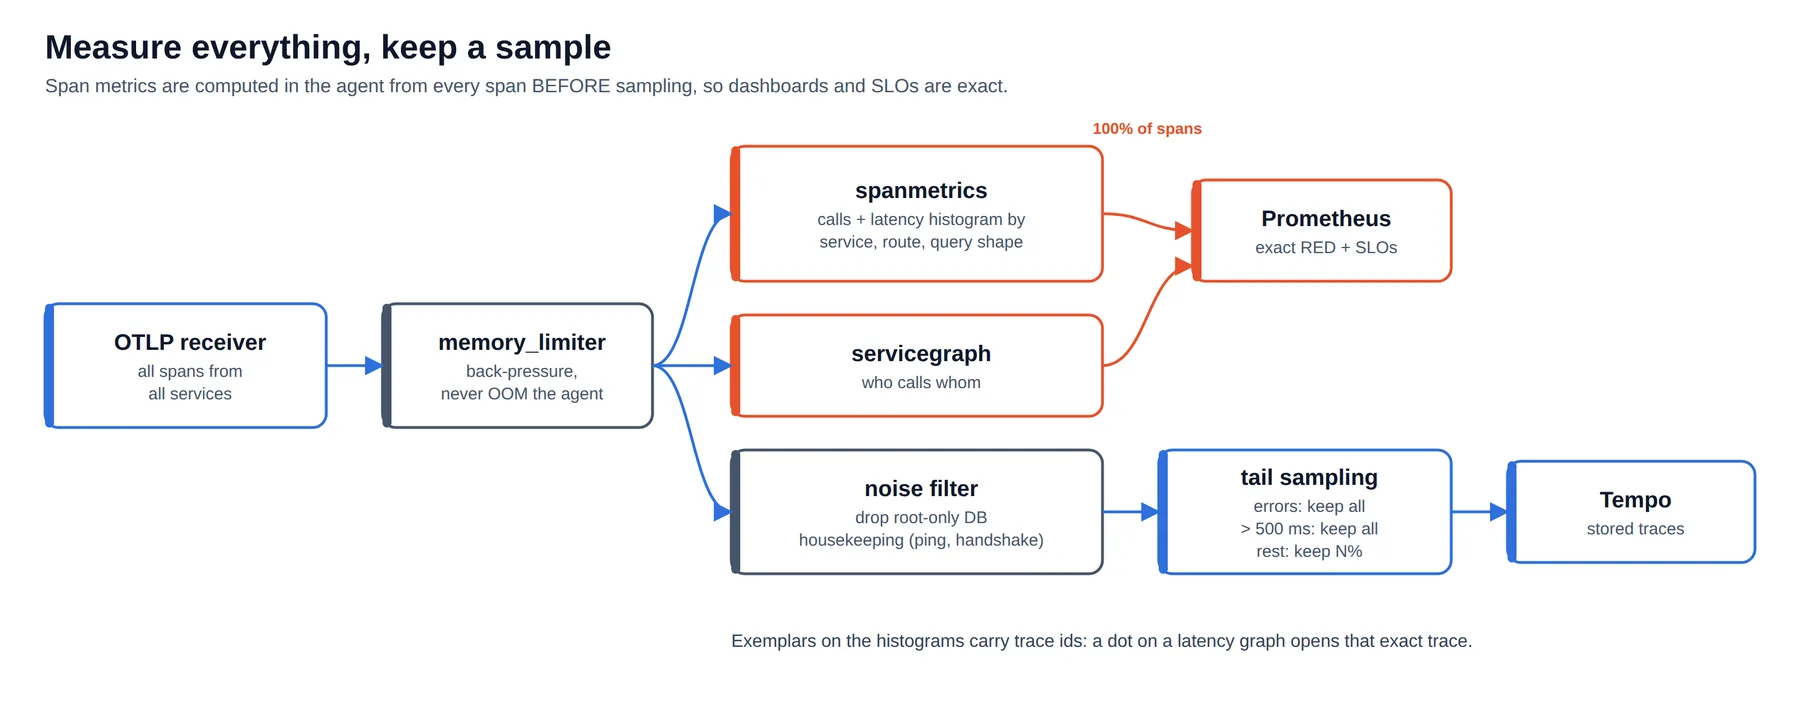
Apps send 100% of spans to the local agent (it is on the same Docker network, so this costs nothing outside the box). In Alloy, the stream forks:
otelcol.processor.memory_limiter "apps" {
  check_interval         = "1s"
  limit_percentage       = 80
  spike_limit_percentage = 20
  output {
    traces = [
      otelcol.processor.transform.for_metrics.input,   // -> spanmetrics (every span)
      otelcol.connector.servicegraph.apps.input,       // -> service map
      otelcol.processor.filter.trace_noise.input,      // -> tail sampling -> Tempo
    ]
    metrics = [otelcol.processor.batch.metrics.input]
    logs    = [otelcol.processor.batch.logs.input]
  }
}

otelcol.connector.spanmetrics "apps" {
  namespace                     = "traces_spanmetrics"
  aggregation_cardinality_limit = 20000

  dimension { name = "http.route" }
  dimension { name = "http.response.status_code" }
  dimension { name = "db.operation.name" }
  dimension { name = "db.mongodb.collection" }
  dimension { name = "db.query.shape" }
  dimension { name = "code.function" }

  histogram {
    unit = "s"
    explicit { buckets = ["5ms", "10ms", "25ms", "50ms", "100ms", "250ms", "500ms", "1s", "2s", "5s", "10s"] }
  }
  exemplars { enabled = true }   // a dot on a latency graph opens that exact trace

  output { metrics = [otelcol.exporter.prometheus.local.input] }
}

otelcol.processor.tail_sampling "apps" {
  decision_wait = "10s"
  num_traces    = 20000
  policy { name = "errors"   type = "status_code"   status_code { status_codes = ["ERROR"] } }
  policy { name = "slow"     type = "latency"       latency     { threshold_ms = 500 } }
  policy { name = "baseline" type = "probabilistic" probabilistic { sampling_percentage = 20 } }
  output { traces = [otelcol.processor.batch.traces.input] }
}
Every request is counted, every error and every slow trace is kept, and only the boring fast-and-successful ones are sampled. (Production traffic turned out low enough that I later raised the baseline to 100%, so "View trace" never says trace not found. The design is the same; it is one number.)
Kill the noise before it costs you
The first week of traces taught me something: about 75% of stored traces were MongoDB driver housekeeping: admin.ping from health checks, connection handshakes, createIndexes at startup. Each is a root span with no parent request, and they buried the real requests in trace search.
They are filtered out of the Tempo branch only, so span metrics still count them, and the same commands inside a real request are kept:
otelcol.processor.filter "trace_noise" {
  error_mode = "ignore"
  traces {
    span = [
      `IsRootSpan() and IsMatch(name, "^admin[.](ping|buildinfo|hello|isMaster|saslStart|saslContinue|endSessions)$")`,
      `IsRootSpan() and IsMatch(name, "[.]createIndexes$")`,
    ]
  }
  output { traces = [otelcol.processor.tail_sampling.apps.input] }
}
The same idea applies to logs: successful health-check lines, successful uptime-probe lines and [UFW BLOCK] port-scan lines (about 11,000 a day on production) are dropped in Alloy, each counted under its own reason so nothing disappears silently. Failed health checks and failed probes are always kept.
6. One click from a log line to its trace
Linking logs and traces sounds like a Grafana setting. In practice, the setting was configured and still nothing linked, because no log line carried a trace id:
- the services mostly
print(); - uvicorn writes its access line after the request span has ended;
- nginx did not record the browser's
traceparent.
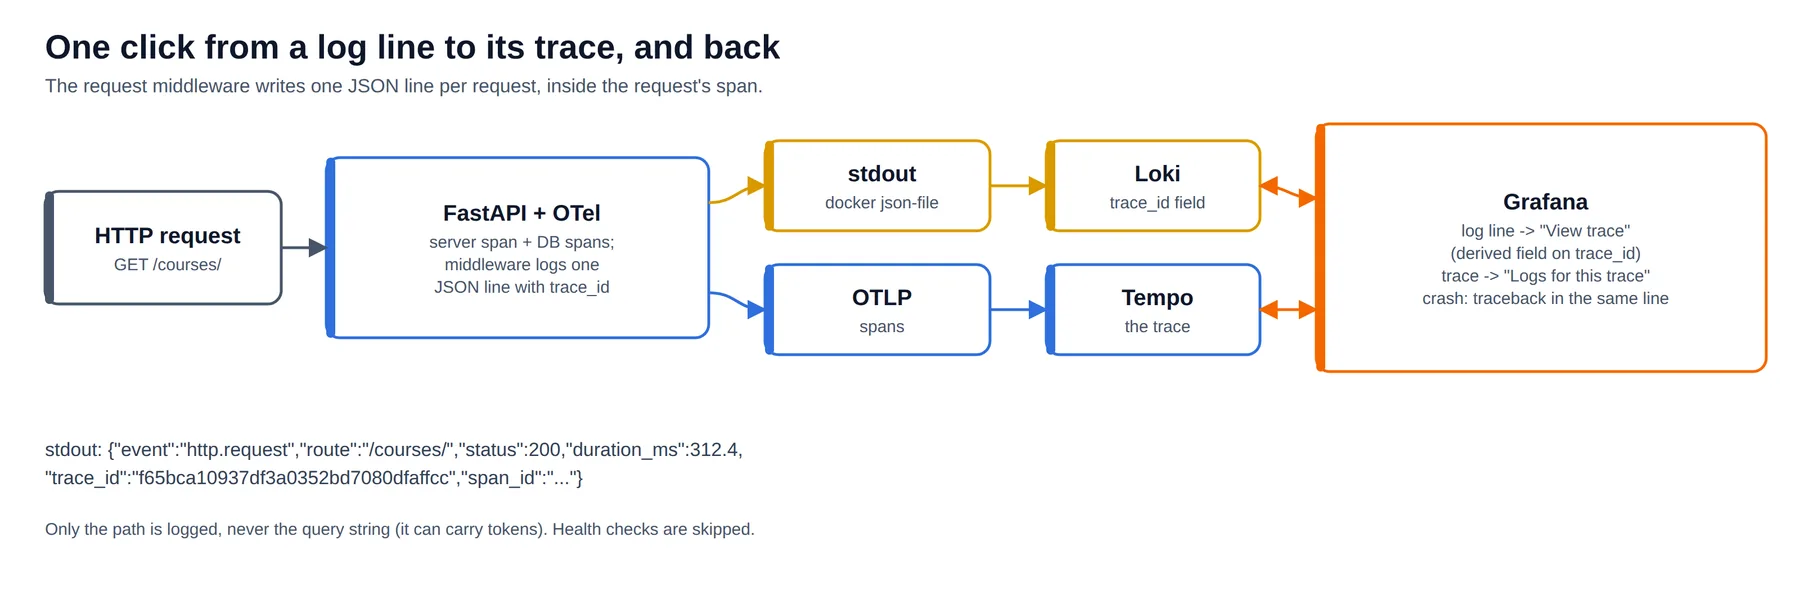
The fix is a tiny ASGI middleware that runs inside the request span and writes one JSON line per request:
class _RequestLog:
    """One JSON line per request to stdout, with the request's trace id.

    Only the path is logged, never the query string, which can carry tokens.
    An unhandled exception adds its type and traceback to the same line,
    so the stack trace is one click from the trace too.
    """
    def __init__(self, app):
        self.app = app

    async def __call__(self, scope, receive, send):
        if scope["type"] != "http" or _is_health(scope.get("path")):
            await self.app(scope, receive, send)
            return
        start = time.perf_counter()
        status, error, stack = 500, None, None

        async def send_and_record(message):
            nonlocal status
            if message["type"] == "http.response.start":
                status = message["status"]
            await send(message)

        try:
            await self.app(scope, receive, send_and_record)
        except Exception as exc:
            error = type(exc).__name__
            stack = traceback.format_exc()[-4000:]   # the innermost frames matter most
            raise
        finally:
            ctx = trace.get_current_span().get_span_context()
            record = {
                "event": "http.request",
                "method": scope.get("method"),
                "route": getattr(scope.get("route"), "path", None),
                "status": status,
                "duration_ms": round((time.perf_counter() - start) * 1000, 1),
                "trace_id": format(ctx.trace_id, "032x") if ctx.is_valid else None,
                "span_id": format(ctx.span_id, "016x") if ctx.is_valid else None,
            }
            if error:
                record["error"], record["exception"] = error, stack
            _request_log.info(json.dumps(record))
uvicorn's own access log is turned off while tracing is on, so each request has exactly one line. In Grafana, a Loki derived field turns the id into a link:
jsonData:
  derivedFields:
    - name: traceID
      matcherType: regex
      matcherRegex: '(?:trace_id|traceID|otelTraceID)[=:" ]+([0-9a-f]{32})'
      datasourceUid: tempo-prod
      url: "$${__value.raw}"
      urlDisplayLabel: "View trace"
The other direction (trace → "Logs for this trace") is a Tempo datasource setting that queries Loki for that trace_id. One gotcha: a plain substring search also matched Grafana's own nginx access lines, because their referer is an Explore URL containing the trace id. The query must match the "trace_id" field, not the text.
I also added a "Failed (5xx) and slow (> 1 s) requests" table to the home dashboard, built from these JSON lines, with the trace id as a link. That table is now the first place we look when someone says "it's broken".
7. The first real win: a slow course list
The course list page took about 1.5 s on dev. The trace answered the question in seconds: six MongoDB queries, one after another, each paying a full network round trip to Atlas. None of them was slow by itself; the latency was the sum of the waits.
Most of them did not depend on each other. Running the independent lookups concurrently (a small thread pool, with contextvars.copy_context() so each query's span stays parented to the request) turned six sequential round trips into two parallel waves:
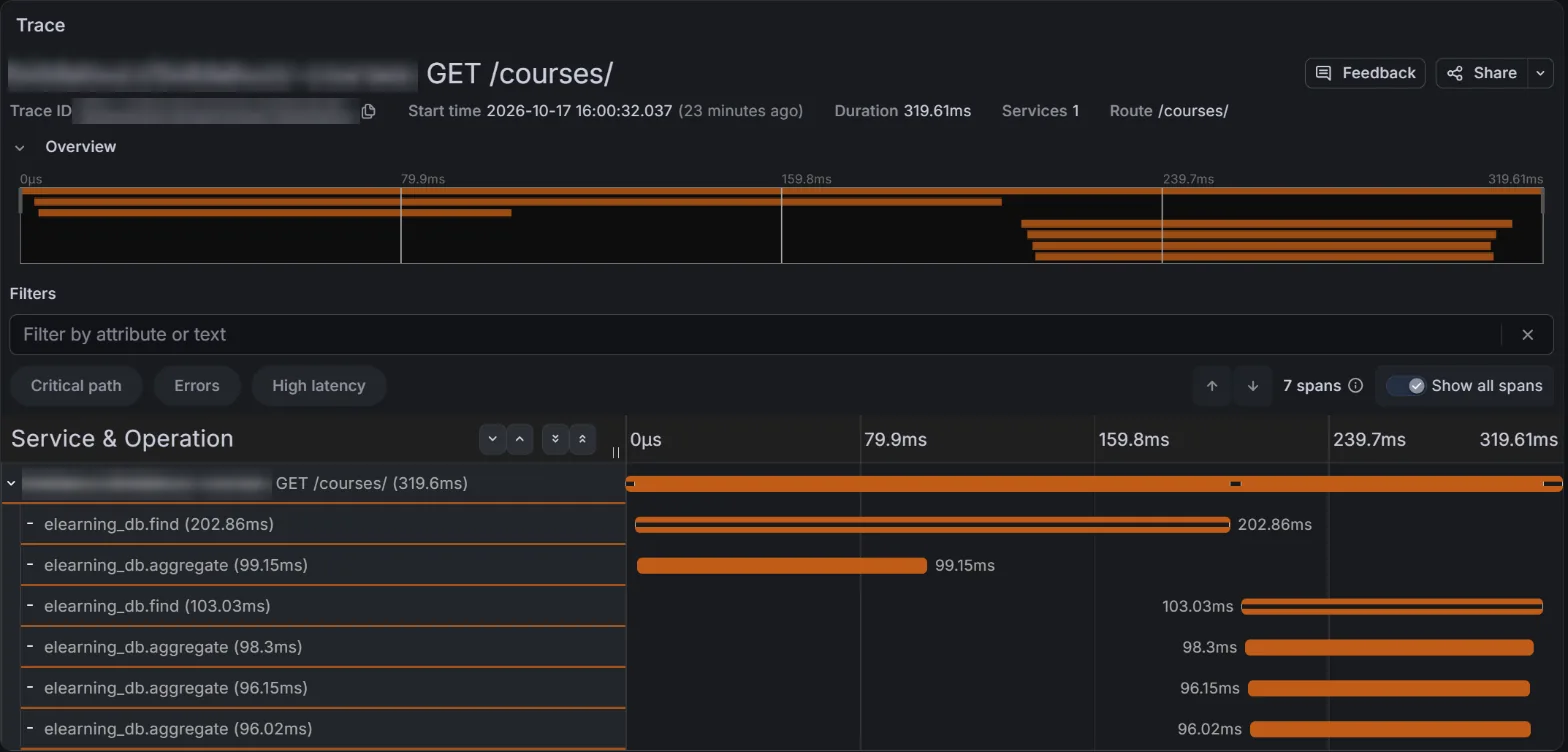
- dev: about 1.5 s → 0.5 s;
- production: about 695 ms → 310 ms;
- output identical to the old code, checked on the same data before the change shipped.
Without traces, the first instinct would have been "add an index", and it would not have helped.
8. Is it the network or the database?
The database is MongoDB Atlas, which is remote, so every query span is network round trip + server execution. When queries get slow, those are two very different problems with two different owners.
Two things separate them:
- The blackbox exporter measures a plain TCP connect (one round trip) to every Atlas node every 15 seconds. TLS handshake time is deliberately not measured: the driver reuses pooled TLS connections, so the handshake is not part of normal query latency. (The first version measured TCP+TLS against a fixed 150 ms threshold and was always firing. That was a false alarm, and the reason for the change.)
- The "slow queries" dashboard overlays that round trip on query p50. If both rise together, it is the network.
The alert is relative, not absolute: the two servers sit in different regions from their clusters (about 120 ms and 245 ms), so one fixed threshold cannot fit both. AtlasLatencyHigh fires when the round trip exceeds 1.8× its own one-day average, and it suppresses the slow-query alerts, so one network problem produces one notification instead of twenty.
9. Alerts people will not mute
Every alert carries four annotations, and all of them reach the notification:
- alert: ContainerOOMKilled
  expr: increase(container_oom_events_total{name!=""}[10m]) > 0
  labels: { severity: warning }
  annotations:
    summary: "Container {{ $labels.name }} was killed for running out of memory"
    description: "{{ $value }} OOM kill(s) in 10 minutes."
    runbook: "Check its memory trend in the cAdvisor dashboard; raise mem_limit or fix the leak."
    dashboard: "/d/cadvisor"
Routing is simple: critical alerts go out within about 10 seconds and repeat hourly; warnings are grouped for 30 seconds and repeat every 6 hours. The part that keeps the channel quiet is inhibition: one cause, one page.
inhibit_rules:
  # A critical alert silences its warning twin.
  - source_matchers: ['severity="critical"']
    target_matchers: ['severity="warning"']
    equal: [alertname, env, service]
  # A slow network to Atlas makes every query slow: report the network, not 20 queries.
  - source_matchers: ['alertname="AtlasLatencyHigh"']
    target_matchers: ['alertname=~"SlowQueryP95|ServiceHighLatencyP95|SiteSlow"']
    equal: [env]
  # The other server being down explains its sites being down.
  - source_matchers: ['alertname="RemoteServerDown"']
    target_matchers: ['alertname="RemoteSiteDown"']
    equal: [env]
  # A container that is down explains its failing health check.
  - source_matchers: ['alertname="ContainerDown"']
    target_matchers: ['alertname=~"BackendHealthFailing|ContainerRestarting"']
    equal: [env, service]
There are about 50 rules across host, containers, availability, database, application, logs (Loki ruler: 5xx ratio, SSH brute force, OOM in the kernel journal, JS error spikes from real users) and the monitoring stack itself.
10. SLOs and error budgets
Fixed thresholds had a blind spot. ServiceHighErrorRate needs a minimum of traffic to be meaningful, and at this platform's traffic level it rarely did. A broken endpoint could fail quietly for days.
So each service got two objectives over 30 days, computed from the span metrics (every request, before sampling):
- availability: 99.5% of requests succeed;
- latency: 95% of requests finish within 1 second.
Recording rules compute the error ratio over several windows:
- record: slo:error_ratio:rate1h
  expr: |
    (
      sum by (service_name) (rate(traces_spanmetrics_calls_total{span_kind="SPAN_KIND_SERVER", status_code="STATUS_CODE_ERROR"}[1h]))
      or
      sum by (service_name) (rate(traces_spanmetrics_calls_total{span_kind="SPAN_KIND_SERVER"}[1h])) * 0
    )
    / sum by (service_name) (rate(traces_spanmetrics_calls_total{span_kind="SPAN_KIND_SERVER"}[1h])) > -1
The or ... * 0 matters: when nothing has failed there is no error series at all, and the ratio would be absent instead of 0. The trailing > -1 drops the NaN produced by services with no traffic.
Alerts use multi-window burn rates from the Google SRE workbook. A burn rate of 14.4 sustained for an hour spends 2% of a 30-day budget; the short window makes the alert resolve quickly once the problem stops:
- alert: ErrorBudgetBurnFast
  expr: |
    slo:error_ratio:rate1h > (14.4 * 0.005) and slo:error_ratio:rate5m > (14.4 * 0.005)
    and on (service_name)
    sum by (service_name) (increase(traces_spanmetrics_calls_total{status_code="STATUS_CODE_ERROR"}[1h])) >= 3
  for: 2m
  labels: { severity: critical }
The last condition is the one tutorials skip: a minimum number of failed requests. Without it, a single failed request on a quiet night is a 100% error ratio, and you get paged for one 500.
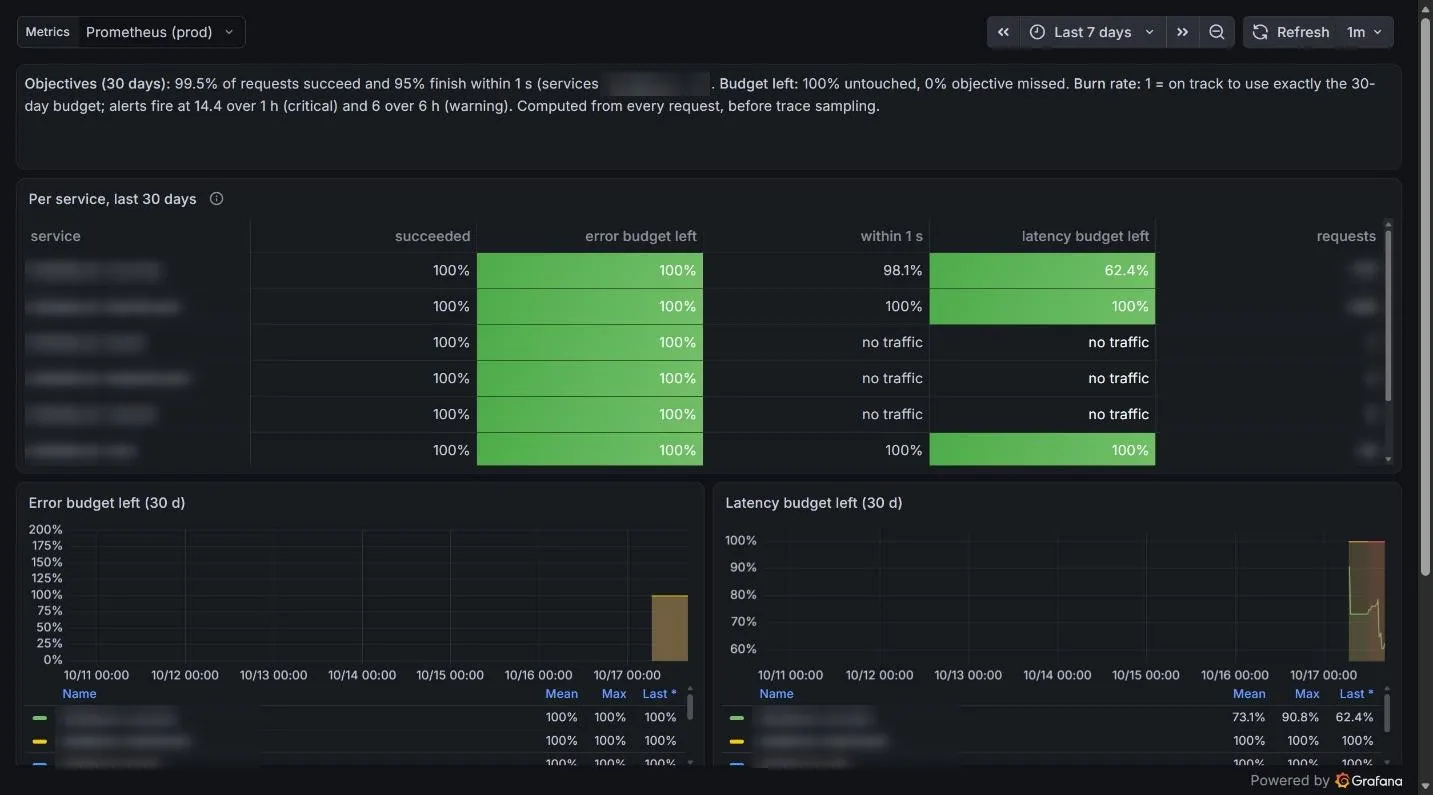
The SLOs paid off on day one. The Django service was missing its latency objective: 6.7% of requests took over a second, against 5% allowed. The slow-queries dashboard showed why: about 20 SQL queries per product page, a classic N+1. A fixed "p95 > 1.5 s" alert would never have noticed.
11. Guardrails: telemetry must never take over the server
Monitoring that shares a box with production needs limits on itself. These are the ones that earned their place:
| Risk | Limit |
|---|---|
| A chatty app floods logs | Loki ingestion 4 MB/s (burst 8), 2 MB/s per stream, lines over 256 KB truncated |
| A trace storm | Tempo 5 MB/s, max 2 MB per trace, 10k live traces; memory_limiter in the agent |
| The stack starves the apps | Memory limit and CPU cap on every container |
| Container logs fill the disk | logging: json-file, max-size 10m, max-file 3 on every compose service |
| Data grows forever | Retention plus a size cap, and an alert per component when its data directory exceeds its budget |
| The disk fills anyway | Warning at 80%, critical at 90%, plus a 24-hour predict_linear alert |
The Docker log cap deserves a line of its own. Before it, two MongoDB containers had 3.4 GB and 3.6 GB of logs. After capping every service, they total a few MB, and production disk use dropped from 51% to 43%.
12. Security
- Grafana access has two independent gates. Cloudflare Access (per-person email login, so strangers never even see the Grafana login page), then Grafana's GitHub OAuth restricted to two GitHub teams: an admin team (Grafana Admin) and a read-only team (Viewer). Roles re-sync at every login, so removing someone from the team on GitHub removes their access; nothing changes on the servers. The password form and basic auth are disabled.
- Origin lockdown. The firewall allows 443 from Cloudflare ranges only.
- The browser telemetry endpoint is public by nature, so it gets a same-origin path, an nginx rate limit (10 req/s per IP), a 256 KB body limit, an API key and a CORS allow-list in Alloy.
- Data hygiene. Query shapes contain no values; no request or response bodies are recorded; query strings are never logged.
- Containers.
no-new-privilegeseverywhere; only the host agent and cAdvisor are privileged, both with read-only mounts and no ports.
13. What went wrong (so it does not happen to you)
Binary data in Loki. One-off docker run alpine tar containers, used to copy volumes during a migration, streamed raw tar data to stdout. Docker logged it, and the agent dutifully shipped about 1.3 GB of binary "log lines" into Loki. Six-hour log queries timed out. Fixes: delete the streams with Loki's delete API, and have the agent collect only containers that belong to a Compose project.
Go and CPU limits. Loki was capped at 1 CPU, but the Go runtime saw all six host cores and scheduled as if it had them. The cgroup throttled it so hard that its own health checks timed out. Set GOMAXPROCS to match the CPU limit for every Go service in a container (Loki, Tempo, Alloy, Grafana). The same six-hour query went from a 60-second timeout to 1.7 seconds.
Grafana OOM. Grafana was OOM-killed three times at a 384 MB limit while serving several six-hour queries at once. Users saw it as random 502s. The fix was more memory (768 MB) plus GOMEMLIMIT=640MiB, so Go's garbage collector works harder before the kernel kills the process. The same 888-query load test then peaked at 621 MB with no restart.
"The API says it works" is not a dashboard test. I first validated all dashboards by replaying their queries against Prometheus and Loki directly: zero errors. Then I opened them in a browser and found that:
- the log dashboards on the production Grafana showed dev data (a datasource variable with no default falls back to the first datasource alphabetically);
- a "Show: All lines" filter with an empty value broke every log panel (Grafana 13 cannot parse an empty custom-variable value and inserts the label text into the query).
Now every dashboard change is checked in a real browser, on both servers, scrolled to the bottom.
Health checks hiding in plain sight. Health checks and uptime probes were the majority of everything: about 1,100 log lines a day per backend, 2,600 probe lines a day per site, and 75% of stored traces. Filter them deliberately and count what you drop.
14. What is next
This is a solid base, not a finished product. In my backlog:
- real notification channels for every severity, with a weekly test alert;
- backups stored off the servers, with an alert on each backup job's last success;
- longer, tamper-evident retention for security-relevant logs (SSH, sudo, access logs) if a compliance audit is on the roadmap;
- thresholds tuned against a few weeks of baseline data.
Takeaways
- Compute metrics before you sample. Span metrics from 100% of spans plus tail sampling gives you exact dashboards and SLOs and a useful trace store, without paying to keep everything.
- A trace id in every request log line is the cheapest, highest-value change in this whole setup.
- Measure the network separately when your database is remote. Otherwise every network blip looks like a query problem.
- SLOs with a minimum-failure condition catch what fixed thresholds miss, without paging on a single error at 3 a.m.
- Give monitoring hard limits, and in containers set
GOMAXPROCSandGOMEMLIMITfor Go services. - Watch the watcher. Two servers cross-probing each other plus an external dead-man switch cost almost nothing.
The whole stack is one Ansible role and a few hundred lines of Alloy and rule files. If you run a small platform on a couple of VMs, you do not need a big budget to see what your system is doing. (On Kubernetes, the starting point is different; see Setting up Prometheus and Grafana on Kubernetes.)